As a starting point the funnel displays how many ideas/entities are currently in each state - as a number and as a % from the total number of ideas/entities, when there is a clear visual separation between the states in the main funnel vs. all the states in the external state group.
This display gives an overview understanding and helps identify bottle necks, and it can be filtered, exported to excel and being subscribed to.

The columns on the right side of the funnel are automatically added from the first three numeric fields listed in the subsystem. They display the total numeric value of all ideas/entities in this state.
Since the numeric fields are usually financial, it helps answering questions like "how much potential revenue is currently being waited to be evaluated etc.

How to determine which fields will be displayed?
In each subsystem, the subsystem admin can select which 3 numeric or formula fields will be displayed in the funnel.
This allows the report to highlight the most relevant KPIs for that specific subsystem.
By tailoring these fields, the funnel can better reflect the business impact and priorities of the team.
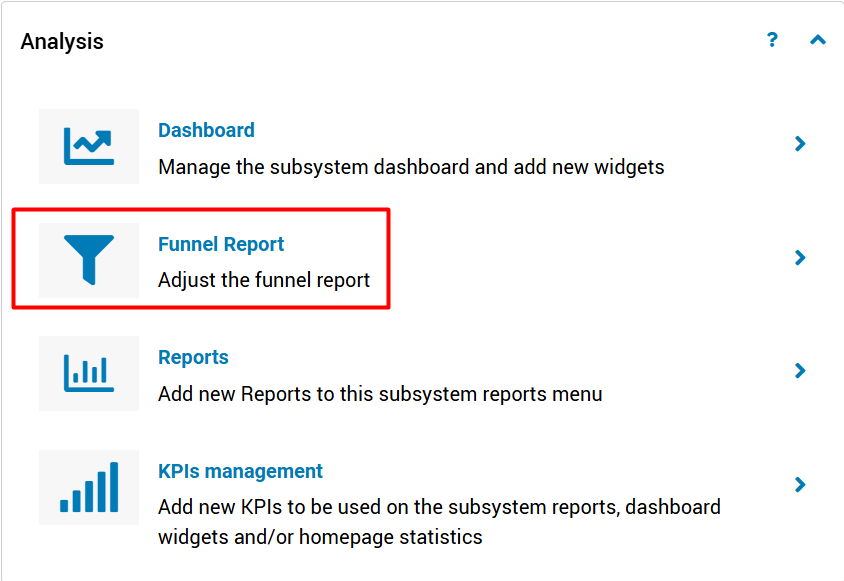
In the Subsystem Settings, under Analysis, click on Funnel Report Settings.
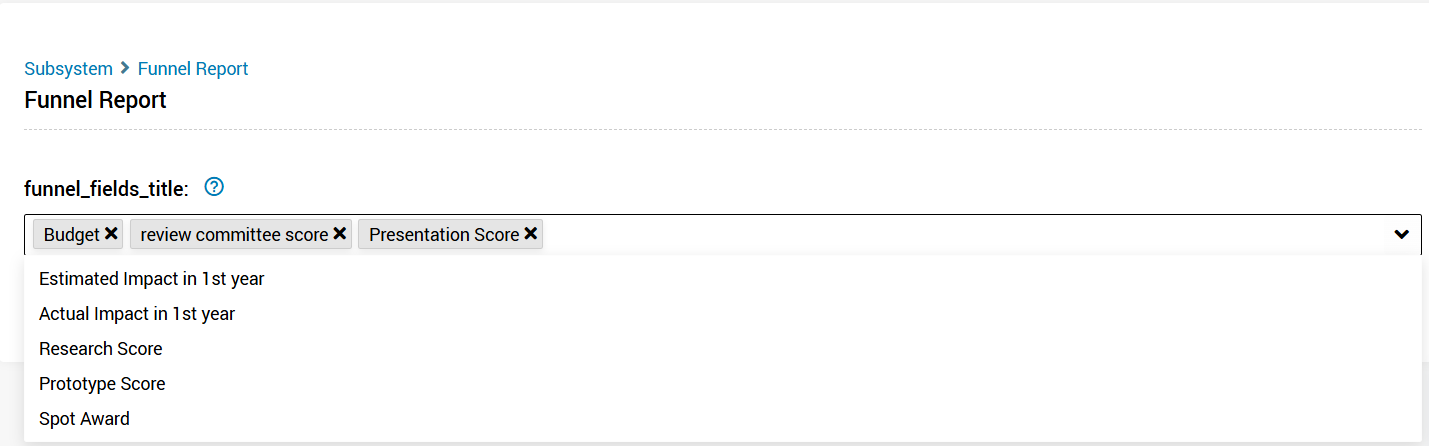
You can select any numeric or formula field. The fields will be displayed according to their order in the setting screen (first submission fields and then workflow fields).
The number on the left grid counts how many ideas/entities has been moved/transitioned from each state to the external states, and when hovering it you can to which one of the external states
In the example below 12 ideas moved from "Supervisor Review" to the external states - 1 for "Clarification" and 11 to "Closed"

Note:
The total of the# of ideas/entities on the external states may be greater than to total sum of the numbers on the grids for several reasons as explained in this article.
Note:
A dynamic 'Last X days' filter is available in the Funnel report, allowing you to automatically display the most recent data. This eliminates the need for manual date updates and helps ensure a consistent, up-to-date view of funnel performance.